This week, I helped a friend implement some interesting features using dynamic tracing tools like eBPF/SystemTap. This article serves as a summary.
Introduction#
In fact, some of the ideas from this week originated from a question a friend asked me one day:
Can we monitor which processes on the machine are sending ICMP requests? We need to obtain the PID, the ICMP packet's source address, destination address, and the process's startup command.
It's an interesting question. When we first encountered this problem, our immediate reaction was, "Why not just have the processes on the machine write logs directly when they send ICMP packets?" Emmmm, let's use a meme to illustrate this.

Well, you probably know what I'm trying to say. In this scenario, we can only choose a bypass, non-intrusive way to do it.
When it comes to bypass tracing of packets, everyone's first reaction is definitely to use tcpdump to capture packets. However, under today's problem, tcpdump can only obtain packet information but cannot get specific PID, startup command, and other information.
So we might need to use other methods to achieve our requirements.
At the very beginning of our requirements, we had several possible approaches:
-
Access /proc/net/tcp to obtain the specific socket's inode information, then reverse lookup the PID association.
-
Use eBPF + kprobe for monitoring.
-
Use SystemTap + kprobe for monitoring.
The first method can only obtain information at the TCP layer, but ICMP is not a TCP protocol (sigh) (although both belong to L4).
So in the end, it seems we only have the option of using eBPF/SystemTap in conjunction with kprobe.
Basic Trace#
Kprobe#
Before we proceed with the actual code operations, we first need to understand Kprobe.
Let’s quote a segment from the official documentation:
Kprobes enables you to dynamically break into any kernel routine and collect debugging and performance information non-disruptively. You can trap at almost any kernel code address, specifying a handler routine to be invoked when the breakpoint is hit. There are currently two types of probes: kprobes, and kretprobes (also called return probes). A kprobe can be inserted on virtually any instruction in the kernel. A return probe fires when a specified function returns. In the typical case, Kprobes-based instrumentation is packaged as a kernel module. The module’s init function installs (“registers”) one or more probes, and the exit function unregisters them. A registration function such as register_kprobe() specifies where the probe is to be inserted and what handler is to be called when the probe is hit.
In simple terms, kprobe is a tracing mechanism provided by the kernel that triggers our callback function according to the rules we set when executing the specific kernel function we defined. In the words of the official documentation, “You can trap at almost any kernel code address.”
In our scenario today, whether using eBPF or SystemTap, we need to rely on Kprobe and choose appropriate hook points to complete our kernel call tracing.
So, in our scenario today, what function should we add the corresponding hook to?
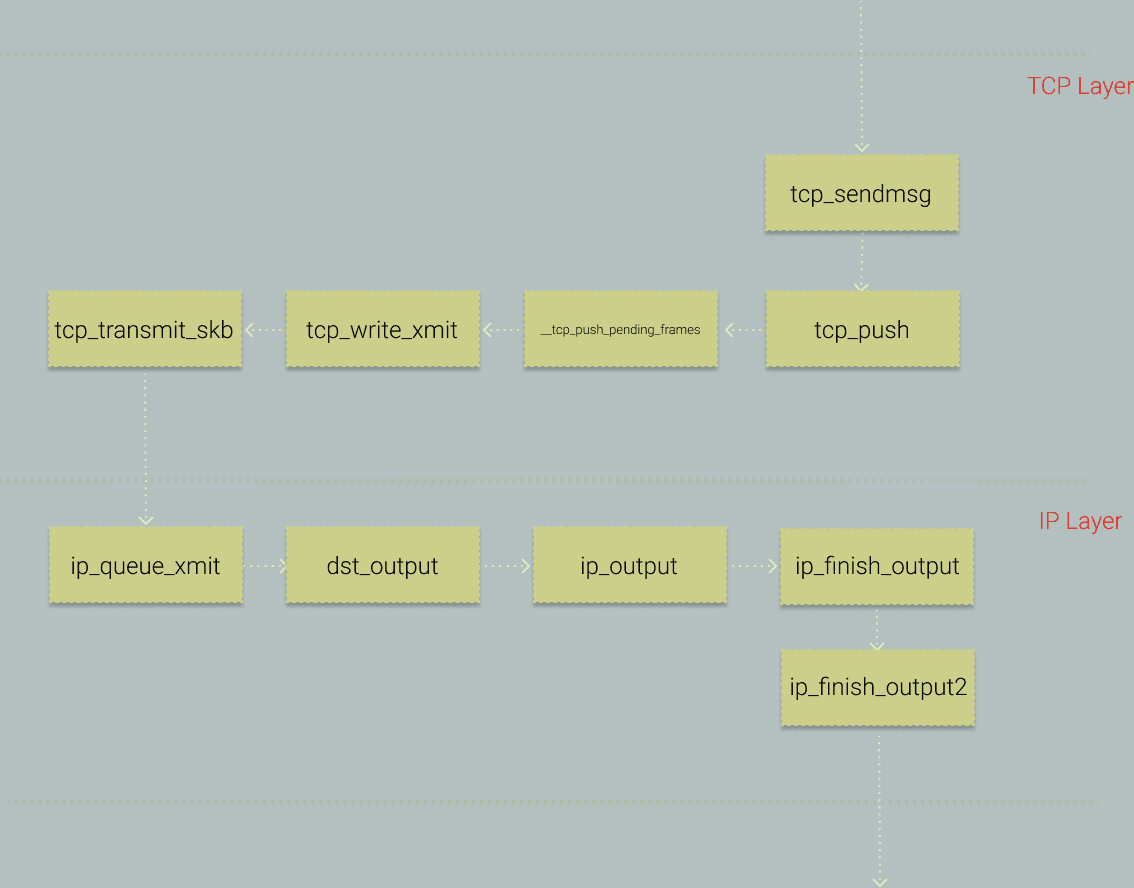
First, let's think about it. ICMP is a layer 4 packet, ultimately encapsulated in an IP packet for distribution. Let's take a look at the key calls in the kernel for sending IP packets, as shown in the figure below.
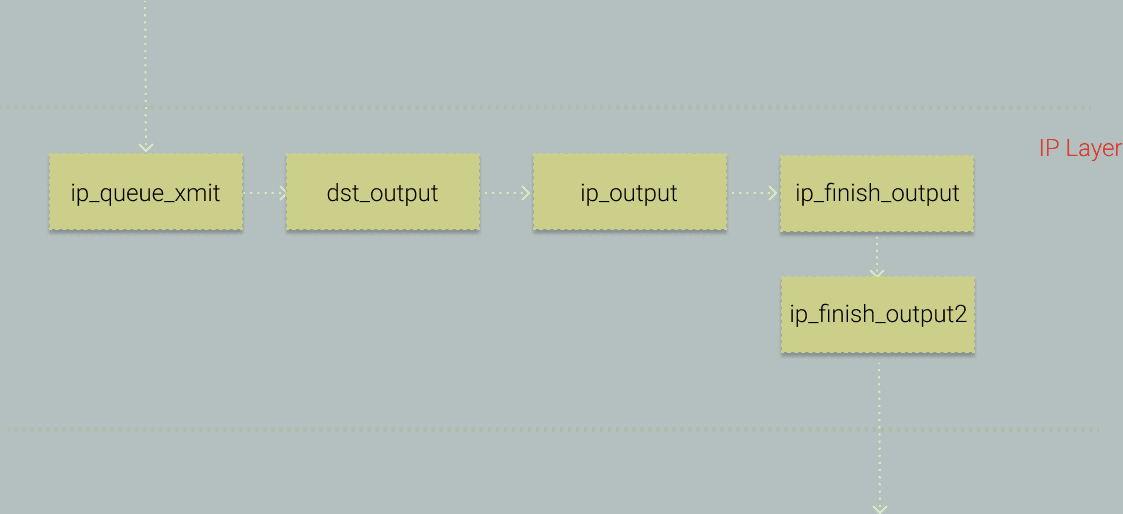
Here, I choose to use ip_finish_output as our hook point.
Okay, with the hook point confirmed, before we start coding, let's briefly introduce ip_finish_output.
ip_finish_output#
First, let's take a look at this function:
static int ip_finish_output(struct net *net, struct sock *sk, struct sk_buff *skb)
{
	int ret;

	ret = BPF_CGROUP_RUN_PROG_INET_EGRESS(sk, skb);
	switch (ret) {
	case NET_XMIT_SUCCESS:
		return __ip_finish_output(net, sk, skb);
	case NET_XMIT_CN:
		return __ip_finish_output(net, sk, skb) ? : ret;
	default:
		kfree_skb(skb);
		return ret;
	}
}
We won't delve into the specific details here (because there are just too many, Orz). When the system call ip_finish_output is triggered, it will invoke our set kprobe hook, and in our defined hook function, we will receive three parameters: net, sk, and skb (these three parameters are also the values when calling ip_finish_output).
Among these three parameters, we mainly focus on struct sk_buff *skb.
Those familiar with the implementation of the Linux Kernel protocol stack will definitely be very familiar with the sk_buff data structure. This data structure is a core data structure related to networking in the Linux Kernel. By continuously offsetting pointers, this data structure can easily help us identify where the data we want to send/receive is stored in memory.
It seems a bit abstract to put it plainly, so let's look at a diagram.
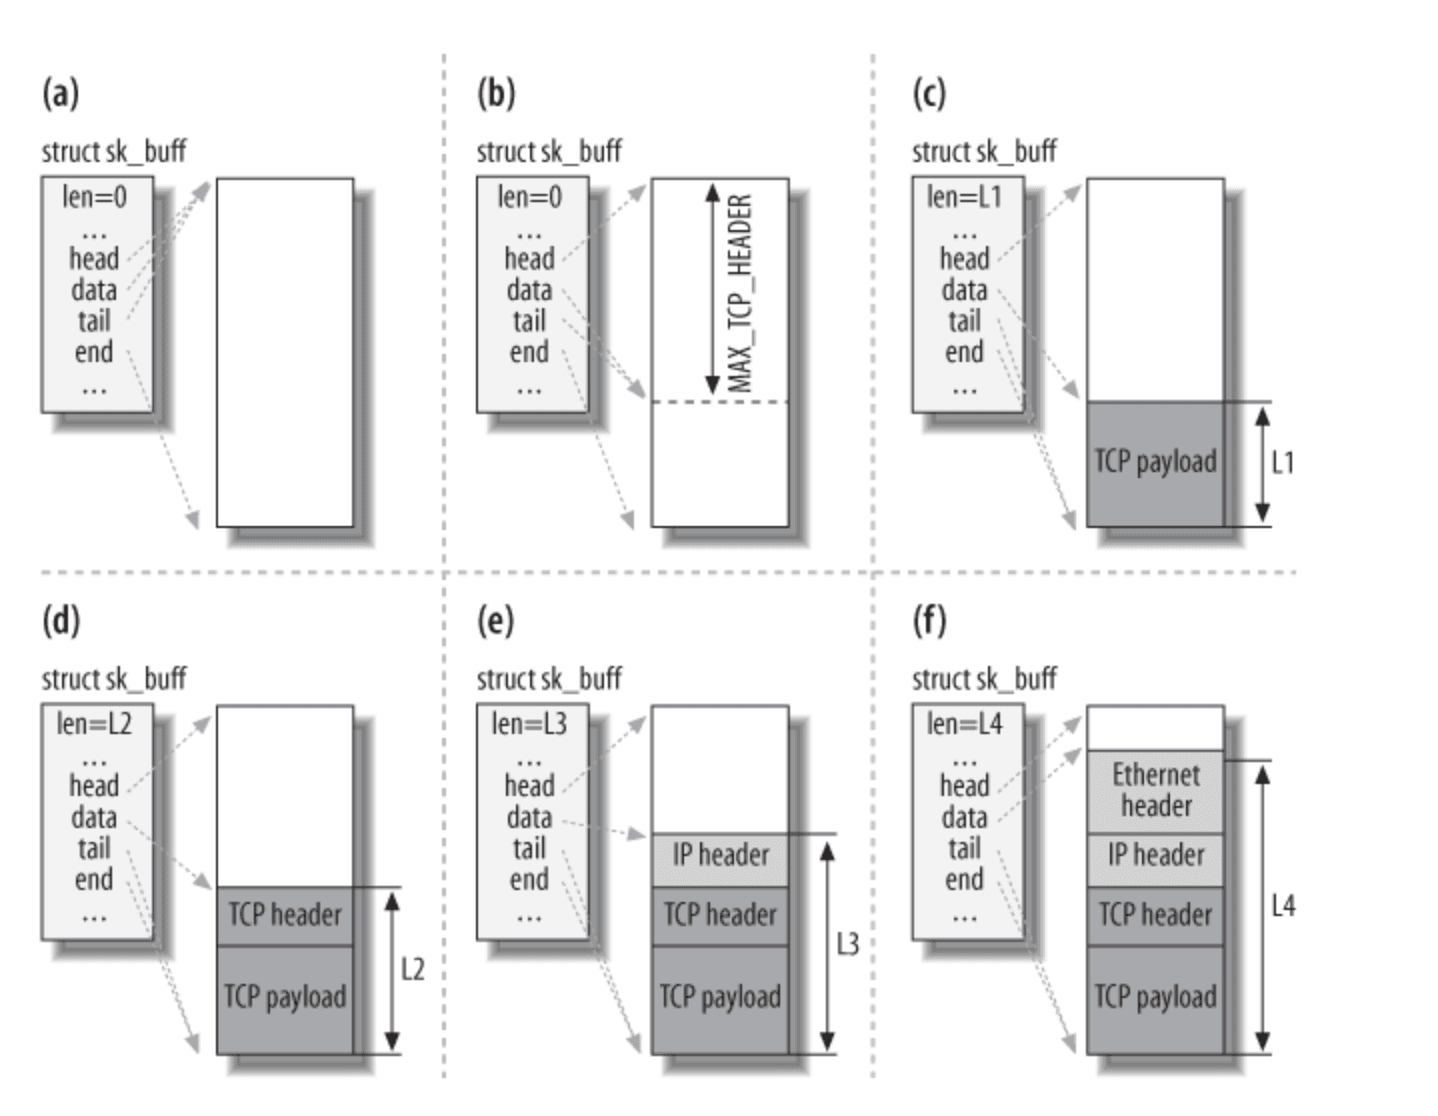
Taking the sending of a TCP packet as an example, we can see that in this diagram, sk_buff goes through six stages:
a. Allocate a buffer based on some options in TCP, such as MSS, etc.
b. Reserve enough space in the allocated memory buffer for all network layer headers (TCP/IP/Link, etc.) according to MAX_TCP_HEADER.
c. Fill in the TCP payload.
d. Fill in the TCP header.
e. Fill in the IP header.
f. Fill in the link header.
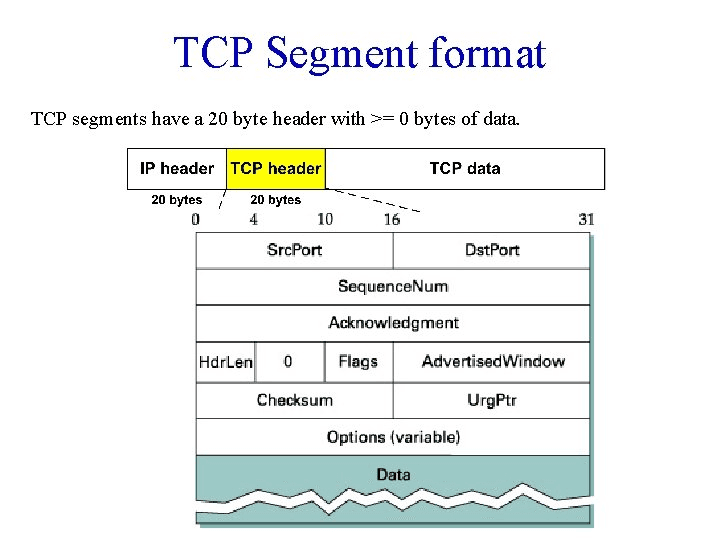
You can refer to the TCP packet structure for a more intuitive understanding.
You can see that through some pointer operations in sk_buff, we can easily access different layer headers and the specific payload.
Okay, now let's officially start implementing the functionality we need.
eBPF + KProbe#
First, let’s briefly introduce eBPF. BPF stands for Berkeley Packet Filter, originally designed to implement some network packet filtering functions in the kernel. However, the community has made many enhancements to it, allowing it to be applied beyond just networking. This is also the origin of the "e" in its name (extend).
Essentially, eBPF maintains a layer of VM in the kernel that can load code generated from specific rules, making the kernel more programmable (I will try to write an introductory article on eBPF from beginner to advanced later).
Tips: Tcpdump is built on BPF.
In this implementation, we used BCC to simplify the difficulty of writing our eBPF code.
Okay, here’s the code:
from bcc import BPF
import ctypes

bpf_text = """
#include <linux/ptrace.h>
#include <linux/sched.h>        /* For TASK_COMM_LEN */
#include <linux/icmp.h>
#include <linux/ip.h>
#include <linux/netdevice.h>

struct probe_icmp_sample {
    u32 pid;
    u32 daddress;
    u32 saddress;
};

BPF_PERF_OUTPUT(probe_events);

static inline unsigned char *custom_skb_network_header(const struct sk_buff *skb)
{
	return skb->head + skb->network_header;
}

static inline struct iphdr *get_iphdr_in_icmp(const struct sk_buff *skb)
{
    return (struct iphdr *)custom_skb_network_header(skb);
}

int probe_icmp(struct pt_regs *ctx, struct net *net, struct sock *sk, struct sk_buff *skb){
    struct iphdr * ipdata=get_iphdr_in_icmp(skb);
    if (ipdata->protocol!=1){
        return 1;
    }
    u64 __pid_tgid = bpf_get_current_pid_tgid();
    u32 __pid = __pid_tgid;
    struct probe_icmp_sample __data = {0};
    __data.pid = __pid;
    u32 daddress;
    u32 saddress;
    bpf_probe_read(&daddress, sizeof(ipdata->daddr), &ipdata->daddr);
    bpf_probe_read(&saddress, sizeof(ipdata->daddr), &ipdata->saddr);
    __data.daddress=daddress;
    __data.saddress=saddress;
    probe_events.perf_submit(ctx, &__data, sizeof(__data));
    return 0;
}

"""


class IcmpSamples(ctypes.Structure):
    _fields_ = [
        ("pid", ctypes.c_uint32),
        ("daddress", ctypes.c_uint32),
        ("saddress", ctypes.c_uint32),
    ]


bpf = BPF(text=bpf_text)

filters = {}


def parse_ip_address(data):
    results = [0, 0, 0, 0]
    results[3] = data & 0xFF
    results[2] = (data >> 8) & 0xFF
    results[1] = (data >> 16) & 0xFF
    results[0] = (data >> 24) & 0xFF
    return ".".join([str(i) for i in results[::-1]])


def print_icmp_event(cpu, data, size):
    event = ctypes.cast(data, ctypes.POINTER(IcmpSamples)).contents
    daddress = parse_ip_address(event.daddress)
    print(
        f"pid:{event.pid}, daddress:{daddress}, saddress:{parse_ip_address(event.saddress)}"
    )


bpf.attach_kprobe(event="ip_finish_output", fn_name="probe_icmp")

bpf["probe_events"].open_perf_buffer(print_icmp_event)
while 1:
    try:
        bpf.kprobe_poll()
    except KeyboardInterrupt:
        exit()
Okay, this code is technically mixed code, with part in C and part in Python. The Python part is familiar to everyone; BCC helps us load our C code and attach it to the kprobe, continuously outputting the data we transmit from the kernel.
Now, let's focus on the C part of the code (which strictly speaking is not standard C, but a layer of DSL encapsulated by BCC).
First, let's look at our two helper functions:
static inline unsigned char *custom_skb_network_header(const struct sk_buff *skb)
{
	return skb->head + skb->network_header;
}

static inline struct iphdr *get_iphdr_in_icmp(const struct sk_buff *skb)
{
    return (struct iphdr *)custom_skb_network_header(skb);
}
As mentioned earlier, we can calculate the address of our IP header in memory based on sk_buff's head and network_header, and then we cast it to an iphdr structure pointer.
Next, let’s take a look at iphdr:
struct iphdr {
#if defined(__LITTLE_ENDIAN_BITFIELD)
	__u8	ihl:4,
		version:4;
#elif defined (__BIG_ENDIAN_BITFIELD)
	__u8	version:4,
  		ihl:4;
#else
#error	"Please fix <asm/byteorder.h>"
#endif
	__u8	tos;
	__be16	tot_len;
	__be16	id;
	__be16	frag_off;
	__u8	ttl;
	__u8	protocol;
	__sum16	check;
	__be32	saddr;
	__be32	daddr;
	/*The options start here. */
};
Those familiar with the IP packet structure will recognize it. Here, saddr and daddr represent our source and destination addresses, and protocol indicates the type of our L4 protocol, where a value of 1 represents the ICMP protocol.
Now, let’s look at our trace function:
int probe_icmp(struct pt_regs *ctx, struct net *net, struct sock *sk, struct sk_buff *skb){
    struct iphdr * ipdata=get_iphdr_in_icmp(skb);
    if (ipdata->protocol!=1){
        return 1;
    }
    u64 __pid_tgid = bpf_get_current_pid_tgid();
    u32 __pid = __pid_tgid;
    struct probe_icmp_sample __data = {0};
    __data.pid = __pid;
    u32 daddress;
    u32 saddress;
    bpf_probe_read(&daddress, sizeof(ipdata->daddr), &ipdata->daddr);
    bpf_probe_read(&saddress, sizeof(ipdata->daddr), &ipdata->saddr);
    __data.daddress=daddress;
    __data.saddress=saddress;
    probe_events.perf_submit(ctx, &__data, sizeof(__data));
    return 0;
}
As mentioned earlier, when the kprobe is triggered, the three parameters of ip_finish_output will be passed to our trace function, allowing us to do many things based on the incoming data. Now let's introduce what the code above does:
- Convert
sk_buffto the correspondingiphdr. - Check if the current packet is an ICMP protocol.
- Use the kernel BPF helper
bpf_get_current_pid_tgidto get the PID of the current process callingip_finish_output. - Retrieve
saddranddaddr. Note that we usebpf_probe_read, which is also a helper function provided by BPF. In principle, in eBPF, to ensure safety, all data reading from the kernel should be done usingbpf_probe_readorbpf_probe_read_kernel. - Submit the data through perf.
This way, we can identify which processes on the machine are sending ICMP requests.
Let’s look at the effect:
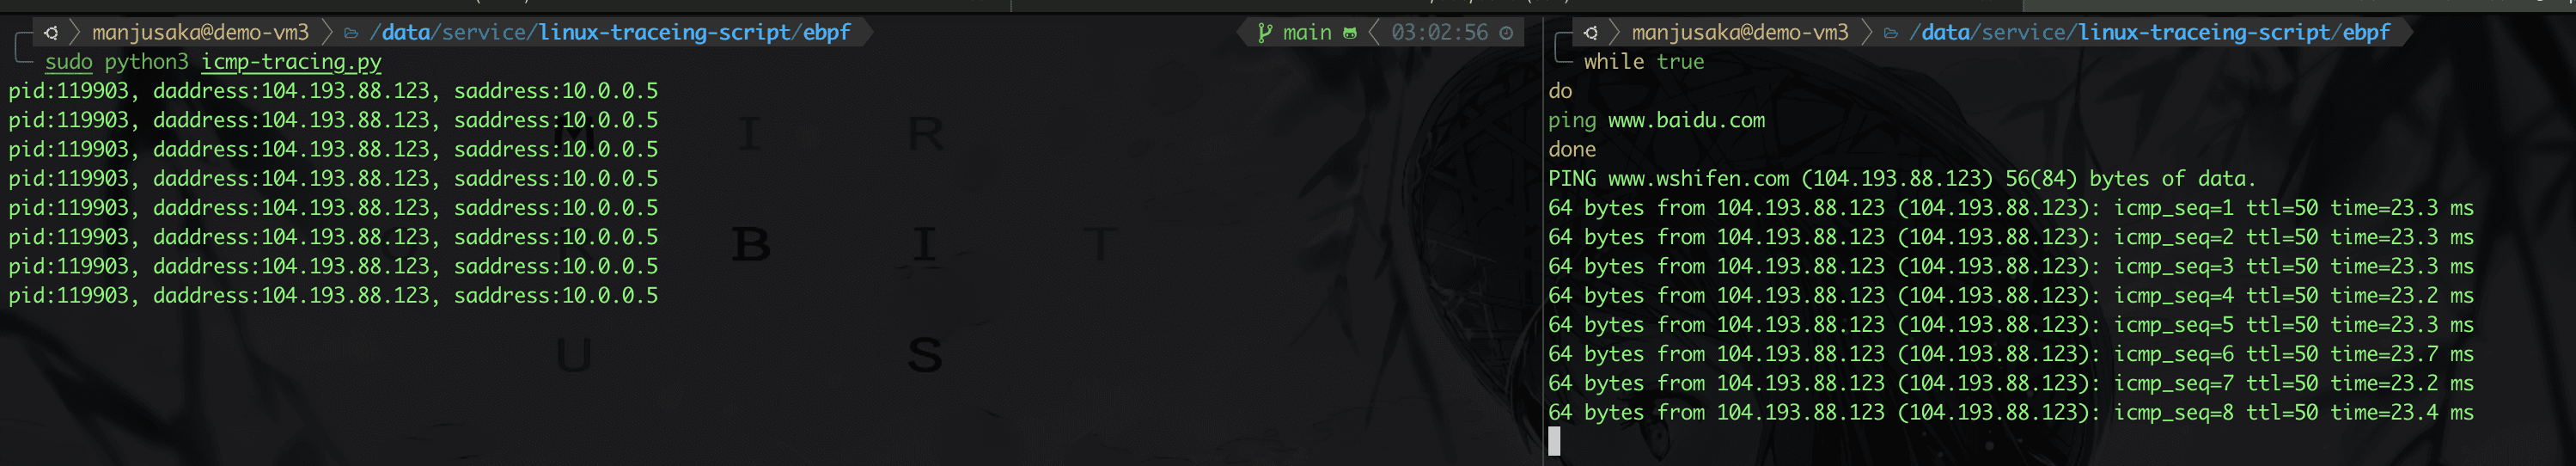
Okay, our requirements are basically met. However, there is a small question left. You can think about how we can obtain the command line of the process based on the PID.
SystemTap + kprobe#
The eBPF version is implemented, but there is a problem: eBPF can only be used in higher versions of the kernel. Generally, on x86_64, Linux 3.16 supports eBPF. The kprobe support for eBPF was implemented in Linux 4.1. Typically, we recommend using kernel versions 4.9 and above in conjunction with eBPF.
So the question arises. In fact, we now have many traditional setups like CentOS 7 + Linux 3.10. What should they do?
Linux 3.10 lives matter! CentOS 7 lives matter!
Well, we have no choice but to switch to another technology stack. At this point, we first consider SystemTap, developed by RedHat and contributed to the community, which is available for lower versions.
%{
#include<linux/byteorder/generic.h>
#include<linux/if_ether.h>
#include<linux/skbuff.h>
#include<linux/ip.h>
#include<linux/in.h>
#include<linux/tcp.h>
#include <linux/sched.h>
#include <linux/list.h>
#include <linux/pid.h>
#include <linux/mm.h>
%}

function isicmp:long (data:long)
%{
    struct iphdr *ip;
    struct sk_buff *skb;
    int tmp = 0;

    skb = (struct sk_buff *) STAP_ARG_data;

    if (skb->protocol == htons(ETH_P_IP)){
            ip = (struct iphdr *) skb->data;
            tmp = (ip->protocol == 1);
    }
    STAP_RETVALUE = tmp;
%}

function task_execname_by_pid:string (pid:long) %{
    struct task_struct *task;

    task = pid_task(find_vpid(STAP_ARG_pid), PIDTYPE_PID);

//     proc_pid_cmdline(p, STAP_RETVALUE);
    snprintf(STAP_RETVALUE, MAXSTRINGLEN, "%s", task->comm);

%}

function ipsource:long (data:long)
%{
    struct sk_buff *skb;
    struct iphdr *ip;
    __be32 src;

    skb = (struct sk_buff *) STAP_ARG_data;

    ip = (struct iphdr *) skb->data;
    src = (__be32) ip->saddr;

    STAP_RETVALUE = src;
%}

/* Return ip destination address */
function ipdst:long (data:long)
%{
    struct sk_buff *skb;
    struct iphdr *ip;
    __be32 dst;

    skb = (struct sk_buff *) STAP_ARG_data;

    ip = (struct iphdr *) skb->data;
    dst = (__be32) ip->daddr;

    STAP_RETVALUE = dst;
%}

function parseIp:string (data:long) %{
    sprintf(STAP_RETVALUE,"%d.%d,%d.%d",(int)STAP_ARG_data &0xFF,(int)(STAP_ARG_data>>8)&0xFF,(int)(STAP_ARG_data>>16)&0xFF,(int)(STAP_ARG_data>>24)&0xFF);
%}


probe kernel.function("ip_finish_output").call {
    if (isicmp($skb)) {
        pid_data = pid()
        /* IP */
        ipdst = ipdst($skb)
        ipsrc = ipsource($skb)
        printf("pid is:%d,source address is:%s, destination address is %s, command is: '%s'\n",pid_data,parseIp(ipsrc),parseIp(ipdst),task_execname_by_pid(pid_data))

    } else {
        next
    }
}
As you can see, our approach is still the same: use ip_finish_output as the kprobe hook point, then retrieve the corresponding iphdr and perform operations.
Well, the basic functionality of our requirements is almost complete. You can further enhance it by obtaining the complete process command line, etc.
Further Thoughts and Experiments#
You may not have a strong sense of the ICMP protocol, which is relatively obscure. So let's change the requirement to something more relatable:
Monitor which processes on the machine are sending HTTP 1.1 requests.
As usual, let's first look at the key calls in the system.
Here, we choose tcp_sendmsg as our entry point.
int tcp_sendmsg(struct sock *sk, struct msghdr *msg, size_t size)
{
	int ret;

	lock_sock(sk);
	ret = tcp_sendmsg_locked(sk, msg, size);
	release_sock(sk);

	return ret;
}
Here, sock is a structure that contains some key metadata.
struct sock {
	/*
	 * Now struct inet_timewait_sock also uses sock_common, so please just
	 * don't add nothing before this first member (__sk_common) --acme
	 */
	struct sock_common	__sk_common;
    ...
}

struct sock_common {
	/* skc_daddr and skc_rcv_saddr must be grouped on a 8 bytes aligned
	 * address on 64bit arches : cf INET_MATCH()
	 */
	union {
		__addrpair	skc_addrpair;
		struct {
			__be32	skc_daddr;
			__be32	skc_rcv_saddr;
		};
	};
	union  {
		unsigned int	skc_hash;
		__u16		skc_u16hashes[2];
	};
	/* skc_dport && skc_num must be grouped as well */
	union {
		__portpair	skc_portpair;
		struct {
			__be16	skc_dport;
			__u16	skc_num;
		};
	};
    ...
}
You can see that we can obtain the quintuple data of our port from sock, and we can get the specific data from msghdr.
For our HTTP requirement, we actually just need to check whether the TCP packet we obtain contains HTTP/1.1 to roughly determine whether the request is an HTTP 1.1 request (a rather brute-force approach, Hhhhh).
Okay, let’s look at the code:
from bcc import BPF
import ctypes
import binascii

bpf_text = """
#include <linux/ptrace.h>
#include <linux/ip.h>
#include <linux/tcp.h>
#include <uapi/linux/ptrace.h>
#include <net/sock.h>
#include <bcc/proto.h>
#include <linux/socket.h>

struct ipv4_data_t {
    u32 pid;
    u64 ip;
    u32 saddr;
    u32 daddr;
    u16 lport;
    u16 dport;
    u64 state;
    u64 type;
    u8 data[300];
    u16 data_size;
};


BPF_PERF_OUTPUT(ipv4_events);

int trace_event(struct pt_regs *ctx,struct sock *sk, struct msghdr *msg, size_t size){
    if (sk == NULL)
        return 0;
    u32 pid = bpf_get_current_pid_tgid() >> 32;


    // pull in details
    u16 family = sk->__sk_common.skc_family;
    u16 lport = sk->__sk_common.skc_num;
    u16 dport = sk->__sk_common.skc_dport;
    char state = sk->__sk_common.skc_state;

    if (family == AF_INET) {
        struct ipv4_data_t data4 = {};
        data4.pid = pid;
        data4.ip = 4;
        //data4.type = type;
        data4.saddr = sk->__sk_common.skc_rcv_saddr;
        data4.daddr = sk->__sk_common.skc_daddr;
        // lport is host order
        data4.lport = lport;
        data4.dport = ntohs(dport);
        data4.state = state;
        struct iov_iter temp_iov_iter=msg->msg_iter;
        struct iovec *temp_iov=temp_iov_iter.iov;
        bpf_probe_read_kernel(&data4.data_size, 4, &temp_iov->iov_len);
        u8 * temp_ptr;
        bpf_probe_read_kernel(&temp_ptr, sizeof(temp_ptr), &temp_iov->iov_base);
        bpf_probe_read_kernel(&data4.data, sizeof(data4.data), temp_ptr);
        ipv4_events.perf_submit(ctx, &data4, sizeof(data4));
    }
    return 0;
}

"""

bpf = BPF(text=bpf_text)

filters = {}


def parse_ip_address(data):
    results = [0, 0, 0, 0]
    results[3] = data & 0xFF
    results[2] = (data >> 8) & 0xFF
    results[1] = (data >> 16) & 0xFF
    results[0] = (data >> 24) & 0xFF
    return ".".join([str(i) for i in results[::-1]])


def print_http_payload(cpu, data, size):
    event = bpf["ipv4_events"].event(data)
    daddress = parse_ip_address(event.daddr)
    body = bytearray(event.data).hex()
    if "48 54 54 50 2f 31 2e 31".replace(" ", "") in body:
        print(
            f"pid:{event.pid}, daddress:{daddress}, saddress:{parse_ip_address(event.saddr)}, {event.lport}, {event.dport}, {event.data_size}"
        )


bpf.attach_kprobe(event="tcp_sendmsg", fn_name="trace_event")

bpf["ipv4_events"].open_perf_buffer(print_http_payload)
while 1:
    try:
        bpf.perf_buffer_poll()
    except KeyboardInterrupt:
        exit()
Okay, let’s look at the effect.
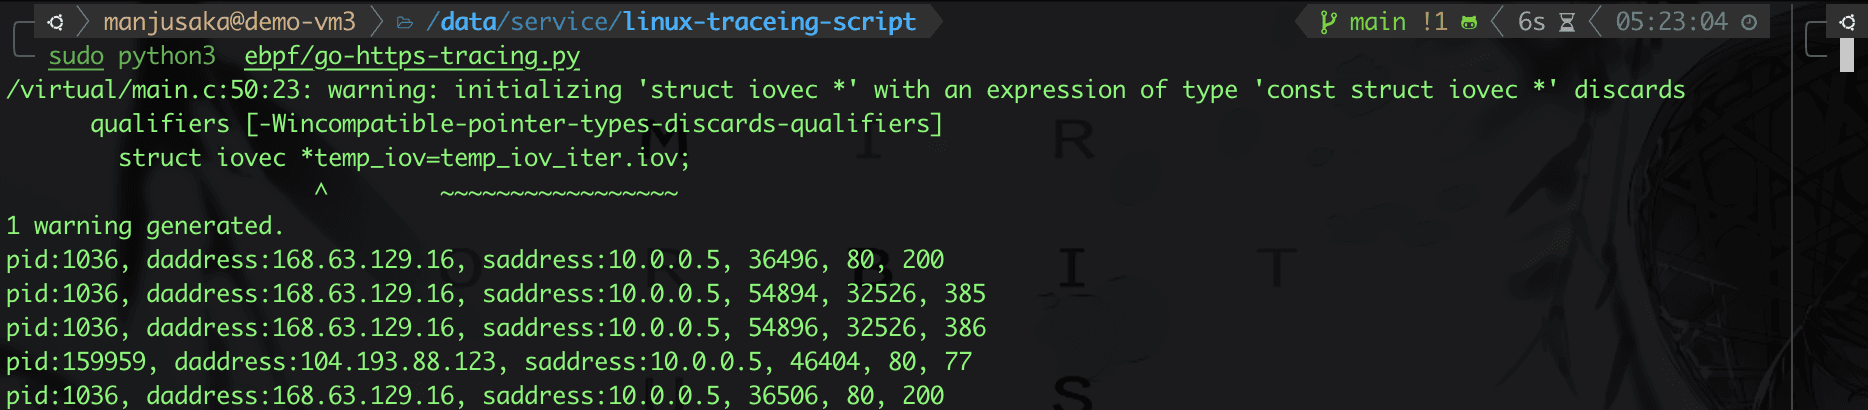
In fact, we can further expand this. For example, for languages like Go, which have fixed characteristics for HTTPS connections, we can also use relatively simple methods to trace the source of packets on the machine (you can refer to this article by Wu Zhe, Why do I always get 503 Service Unavailable when accessing a website with Go?).
I also did a test; you can refer to the code: https://github.com/Zheaoli/linux-traceing-script/blob/main/ebpf/go-https-tracing.py.
Conclusion#
In fact, whether it is eBPF or SystemTap, these dynamic tracing technologies can make the Linux Kernel more programmable. Compared to traditional methods like recompiling the kernel, they are more convenient and faster. The emergence of frameworks like BCC/BPFTrace, which further encapsulate these technologies, has further reduced the difficulty of observing the kernel.
Many times, we can choose a bypass method to achieve our needs more quickly. However, it is important to note that the introduction of dynamic tracing technology inevitably increases the instability of the kernel and may affect performance to some extent. Therefore, we need to make trade-offs based on specific scenarios.
Well, this article is about to wrap up. I hope to produce a series of articles on eBPF from beginner to advanced when I have time (flag++).