This might be the last article of 2021 (Lunar New Year), or it could be the first article of 2022, but that entirely depends on when I finish writing it. This time, let's have a simple discussion about network monitoring in Linux.
Introduction#
This article is both a piece of water literature and not a piece of water literature. However, it is still aimed at beginners. This article has actually been sitting in my drafts for over a year, and the inspiration initially came from some of my work at Alibaba (which can be considered a leading but somewhat niche job in the domestic market (XD).
With the development of technology, the demand for service stability is increasing, and ensuring service quality requires adequate monitoring coverage (Alibaba's requirement for service stability is called "1-5-10," meaning one minute to detect, five minutes to handle, and ten minutes to self-recover. Without sufficient coverage in monitoring for such stability requirements, everything is equivalent to a circle). Among these, monitoring network quality is of utmost importance.
Before discussing network quality monitoring, we need to clarify the scope of the definition of network quality.
- Abnormal situations on the network link
- The processing capacity of the server's network
After clarifying this scope, we can think about what indicators represent a decline in network quality. (Note: This article mainly analyzes monitoring of TCP and over TCP protocols, and will not elaborate further.)
- Undoubtedly, if we have packet loss
- Send/receive queue blockage
- Timeouts
Now, let's look at the specific details.
- As proposed in RFC7931, RTO, and Retransmission Timer as proposed in RFC62982, can measure packet transmission time. A rough summary is that the larger these two indicators are, the lower the network quality.
- As proposed in RFC20183, SACK, an imprecise summary is that the more SACKs there are, the more packet loss there is.
- If our connection is frequently reset by RST, it also indicates that there is a problem with our network quality.
Of course, in actual production processes, we can also use many other indicators to assist in measuring network quality. However, since this article mainly introduces the thought process with a focus on the prototype, I won't elaborate too much.
After clarifying what indicators we want to obtain in this article, let's analyze how we can obtain these indicators.
Kernel Network Quality Monitoring#
Brutal Version#
Obtaining network metrics from the kernel essentially means obtaining the running status from the kernel. Speaking of this, those who have some understanding of Linux will surely first think of checking The Proc Filesystem4 to see if we can obtain specific indicators. Yep, that's a good idea; in fact, we can obtain some indicators (this is also the principle behind tools like netstat).
In /proc/net/tcp, we can obtain metrics output by the kernel, which currently includes the following:
- Connection status
- Local port, address
- Remote port, address
- Receive queue length
- Send queue length
- Slow start threshold
- RTO value
- Inode ID of the socket to which the connection belongs
- UID
- Delay ACK soft clock
For a complete explanation, please refer to proc_net_tcp.txt5.
This approach may be acceptable for a prototype, but its inherent drawbacks limit large-scale production use.
- The kernel has clearly stated that the use of proc_net_tcp.txt5 is not recommended, in other words, it does not guarantee future compatibility and maintenance.
- The metric information directly provided by the kernel is still too limited; some indicators like RTT and SRTT cannot be obtained, nor can specific events like SACK.
- There are issues with real-time performance and accuracy based on the metrics output by the kernel. In other words, we can attempt this area without considering accuracy.
- proc_net_tcp.txt5 is bound to the network namespace, meaning that in container scenarios, we need to traverse potentially multiple network namespaces, constantly using
nsenterto obtain the corresponding metrics.
So, in this context, proc_net_tcp.txt5 is not very suitable for large-scale usage scenarios. Therefore, we need to optimize it further.
Optimization Version 1.0#
In the previous section, we mentioned the drawbacks of directly obtaining data from The Proc Filesystem4. One important point mentioned is:
The kernel has clearly stated that the use of proc_net_tcp.txt5 is not recommended, in other words, it does not guarantee future compatibility and maintenance.
So what is the recommended approach? The answer is netlink + sock_diag.
To briefly introduce, netlink6 is a mechanism introduced in Linux 2.2 for communication between Kernel Space and User Space, initially proposed by RFC35497. The official description of netlink6 is roughly as follows:
Netlink is used to transfer information between the kernel and user-space processes. It consists of a standard sockets-based interface for user space processes and an internal kernel API for kernel modules.
The internal kernel interface is not documented in this manual page. There is also an obsolete netlink interface via netlink character devices; this interface is not documented here and is provided only for backward compatibility.
In simple terms, users can easily interact with different Kernel Modules in the kernel using netlink6.
In our scenario, we need to utilize sock_diag8, which is officially described as:
The sock_diag netlink subsystem provides a mechanism for obtaining information about sockets of various address families from the kernel. This subsystem can be used to obtain information about individual sockets or request a list of sockets.
In short, we can use sock_diag7 to obtain the connection status and corresponding metrics of different sockets (we can obtain all the indicators mentioned above, as well as more detailed RTT metrics). By the way, it is important to note that netlink6 can be configured to obtain metrics from all Network Namespaces.
When using netlink6, writing in Pure C can be relatively cumbersome. Fortunately, the community has several well-packaged libraries, such as the netlink library8 packaged by vishvananda. Here is a demo:
package main

import (
    "fmt"

	"github.com/vishvananda/netlink"
	"syscall"
)

func main() {
	results, err := netlink.SocketDiagTCPInfo(syscall.AF_INET)
	if err != nil {
		return
	}
	for _, item := range results {
		if item.TCPInfo != nil {
			fmt.Printf("Source:%s, Dest:%s, RTT:%d\n", item.InetDiagMsg.ID.Source.String(), item.InetDiagMsg.ID.Destination.String(), item.TCPInfo.Rtt)
		}
	}
}
The running example looks like this:
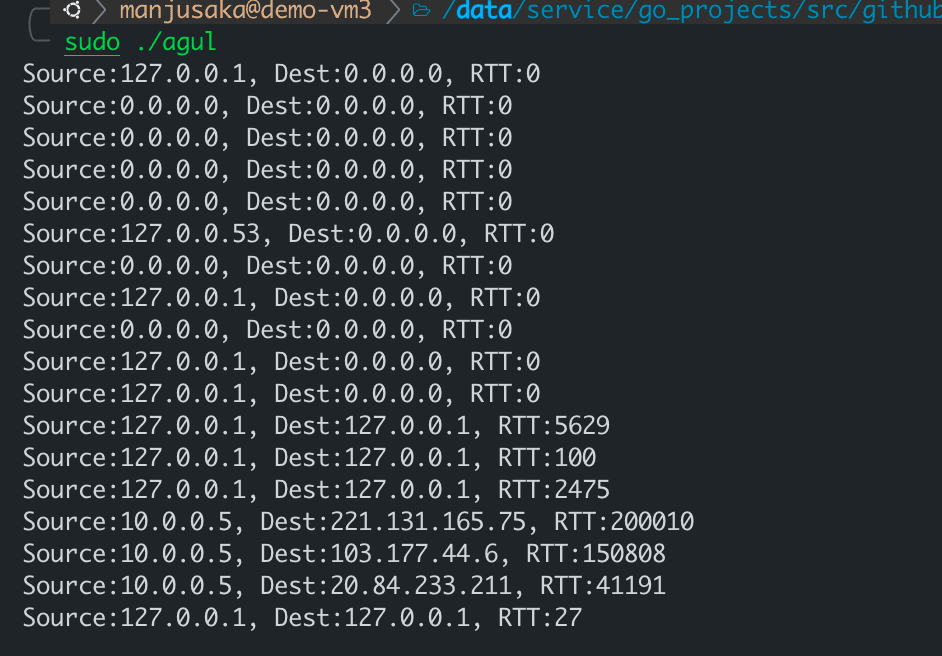
OK, now we can use the officially recommended Best Practice to obtain more comprehensive and detailed metrics without worrying about the Network namespace issue. However, we still have a relatively tricky problem regarding real-time performance.
Because if we choose periodic polling, we will lose the corresponding scene if network fluctuations occur during our polling interval. So how do we solve the real-time issue?
Optimization Version 2.0#
If we want to directly trigger our calls when specific events like retransmissions or connection resets occur, those who have read my previous blog might immediately consider using a combination of eBPF + kprobe to hit key calls like tcp_reset, tcp_retransmit_skb, etc., to obtain real-time data. Sounds good!
However, there are still some minor issues.
- The overhead of kprobe can be relatively high in high-frequency situations.
- If we only need information such as source_address, dest_address, source_port, dest_port, it is somewhat wasteful to go through kprobe to obtain the complete skb and then cast it.
So, is there a better method? Yes!
In Linux, there is a basic infrastructure called Tracepoint9 for triggering and callback scenarios for a series of special events similar to our needs. This infrastructure can effectively help us handle the need for listening to events and callbacks. After Linux 4.15 and 4.16, six TCP-related Tracepoints9 were added:
- tcp
- tcp
- tcp
- tcp
- tcp
- tcp
The meanings of these Tracepoints9 can be understood just by looking at their names.
When these Tracepoints9 are triggered, they will pass several parameters to the registered callback function. Here, I will list them for you:
tcp:tcp_retransmit_skb
    const void * skbaddr;
    const void * skaddr;
    __u16 sport;
    __u16 dport;
    __u8 saddr[4];
    __u8 daddr[4];
    __u8 saddr_v6[16];
    __u8 daddr_v6[16];
tcp:tcp_send_reset
    const void * skbaddr;
    const void * skaddr;
    __u16 sport;
    __u16 dport;
    __u8 saddr[4];
    __u8 daddr[4];
    __u8 saddr_v6[16];
    __u8 daddr_v6[16];
tcp:tcp_receive_reset
    const void * skaddr;
    __u16 sport;
    __u16 dport;
    __u8 saddr[4];
    __u8 daddr[4];
    __u8 saddr_v6[16];
    __u8 daddr_v6[16];
tcp:tcp_destroy_sock
    const void * skaddr;
    __u16 sport;
    __u16 dport;
    __u8 saddr[4];
    __u8 daddr[4];
    __u8 saddr_v6[16];
    __u8 daddr_v6[16];
tcp:tcp_retransmit_synack
    const void * skaddr;
    const void * req;
    __u16 sport;
    __u16 dport;
    __u8 saddr[4];
    __u8 daddr[4];
    __u8 saddr_v6[16];
    __u8 daddr_v6[16];
tcp:tcp_probe
    __u8 saddr[sizeof(struct sockaddr_in6)];
    __u8 daddr[sizeof(struct sockaddr_in6)];
    __u16 sport;
    __u16 dport;
    __u32 mark;
    __u16 length;
    __u32 snd_nxt;
    __u32 snd_una;
    __u32 snd_cwnd;
    __u32 ssthresh;
    __u32 snd_wnd;
    __u32 srtt;
    __u32 rcv_wnd;
Well, seeing this, you might have an idea in mind, so let's write a sample code.
from bcc import BPF

bpf_text = """
BPF_RINGBUF_OUTPUT(tcp_event, 65536);

enum tcp_event_type {
    retrans_event,
    recv_rst_event,
};

struct event_data_t {
    enum tcp_event_type type;
    u16 sport;
    u16 dport;
    u8 saddr[4];
    u8 daddr[4];
    u32 pid;
};

TRACEPOINT_PROBE(tcp, tcp_retransmit_skb)
{
    struct event_data_t event_data={};
    event_data.type = retrans_event;
    event_data.sport = args->sport;
    event_data.dport = args->dport;
    event_data.pid=bpf_get_current_pid_tgid()>>32;
    bpf_probe_read_kernel(&event_data.saddr,sizeof(event_data.saddr), args->saddr);
    bpf_probe_read_kernel(&event_data.daddr,sizeof(event_data.daddr), args->daddr);
    tcp_event.ringbuf_output(&event_data, sizeof(struct event_data_t), 0);
    return 0;
}

TRACEPOINT_PROBE(tcp, tcp_receive_reset)
{
    struct event_data_t event_data={};
    event_data.type = recv_rst_event;
    event_data.sport = args->sport;
    event_data.dport = args->dport;
    event_data.pid=bpf_get_current_pid_tgid()>>32;
    bpf_probe_read_kernel(&event_data.saddr,sizeof(event_data.saddr), args->saddr);
    bpf_probe_read_kernel(&event_data.daddr,sizeof(event_data.daddr), args->daddr);
    tcp_event.ringbuf_output(&event_data, sizeof(struct event_data_t), 0);
    return 0;
}

"""

bpf = BPF(text=bpf_text)


def process_event_data(cpu, data, size):
    event = bpf["tcp_event"].event(data)
    event_type = "retransmit" if event.type == 0 else "recv_rst"
    print(
        "%s %d %d %s %s %d"
        % (
            event_type,
            event.sport,
            event.dport,
            ".".join([str(i) for i in event.saddr]),
            ".".join([str(i) for i in event.daddr]),
            event.pid,
        )
    )


bpf["tcp_event"].open_ring_buffer(process_event_data)


while True:
    bpf.ring_buffer_consume()
Here, I used tcp_receive_reset and tcp_retransmit_skb to monitor the programs on our machine. To demonstrate the specific effect, I first wrote a Go program to access Google, and then used sudo iptables -I OUTPUT -p tcp -m string --algo kmp --hex-string "|c02bc02fc02cc030cca9cca8c009c013c00ac014009c009d002f0035c012000a130113021303|" -j REJECT --reject-with tcp-reset to inject a Connection Reset into this Go program (the injection principle here is that the default library of Go has a fixed feature for initiating HTTPS connections, and I used iptables to identify the directional traffic and reset the connection).
The effect is as follows:
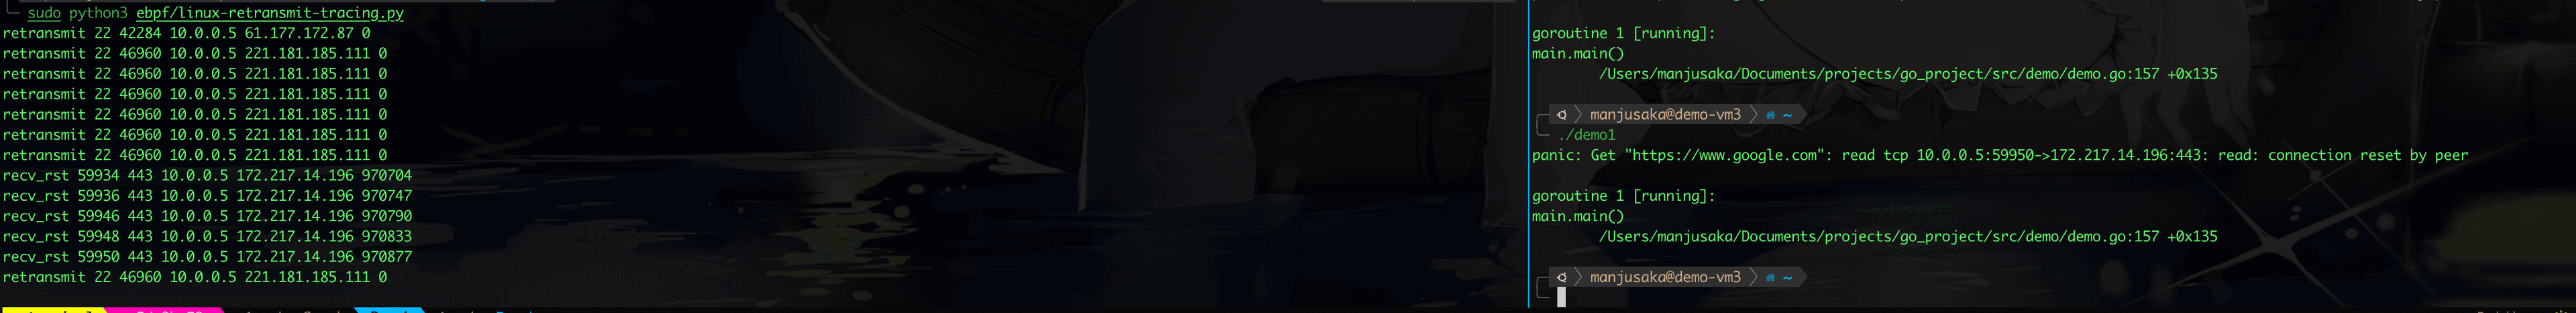
Well, at this point, you might have realized that we can combine Tracepoints9 and netlink6 to meet our real-time needs.
Optimization Version 3.0#
In fact, up to this point, I have mostly discussed prototypes and thought processes. To meet production needs, there is still a lot of work to be done (this is also part of the work I have done before), including but not limited to:
- Performance optimization in engineering to avoid impacting services
- Compatibility with container platforms like Kubernetes
- Integration with data monitoring platforms like Prometheus
- Possibly embedding CNI to obtain a more convenient monitoring path, etc.
In fact, the community has also done a lot of interesting work in this area, such as Cilium, which you can also follow if you're interested. I will also tidy up the code later and open-source some of my previous implementation paths at the appropriate time.
Conclusion#
This article is about to conclude. Kernel network monitoring is ultimately a relatively niche field. I hope some of my experiences can help everyone. Well, I wish everyone a Happy New Year! May the Year of the Tiger bring you good fortune! (The next article will be about last year's year-end summary.)
Reference#
- RFC793: https://datatracker.ietf.org/doc/html/rfc793
- RFC6298: https://datatracker.ietf.org/doc/html/rfc6298
- RFC2018: https://datatracker.ietf.org/doc/html/rfc2018
- The /proc Filesystem: https://www.kernel.org/doc/html/latest/filesystems/proc.html
- proc_net_tcp.txt: https://www.kernel.org/doc/Documentation/networking/proc_net_tcp.txt
- netlink: https://man7.org/linux/man-pages/man7/netlink.7.html
- sock_diag: https://man7.org/linux/man-pages/man7/sock_diag.7.html
- vishvananda/netlink: https://github.com/vishvananda/netlink
- Linux Tracepoint: https://www.kernel.org/doc/html/latest/trace/tracepoints.html